The skyline of Singapore as viewed from the Marina Promenade (shown on the left) is one of the iconic scenes of Singapore. Country X would also like to create an iconic skyline, and it has put up a call for proposals. Each submitted proposal is a description of a proposed skyline and one of the metrics that country X will use to evaluate a proposed skyline is the amount of overlap in the proposed sky-line.
As the assistant to the chair of the skyline evaluation committee, you have been tasked with determining the amount of overlap in each proposal. Each proposal is a sequence of buildings,
 b1, b2,..., bn
 , where a building is specified by its left and right endpoint and its height. The buildings are specified in back to front order, in other words a building which appears later in the sequence appears in front of a building which appears earlier in the sequence.
The skyline formed by the first k
buildings is the union of the rectangles of the first k
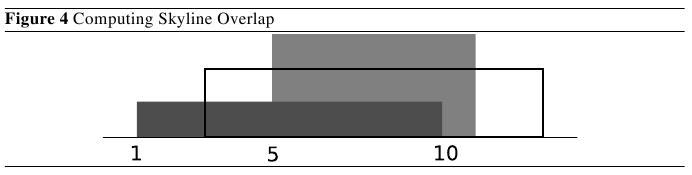
buildings (see Figure 4). The overlap of a building, bi
, is defined as the total horizontal length of the parts of bi
, whose height is greater than or equal to the skyline behind it. This is equivalent to the total horizontal length of parts of the skyline behind bi
which has a height that is less than or equal to hi
, where hi
is the height of building bi
. You may assume that initially the skyline has height zero everywhere.
The input consists of a line containing the number c
of datasets, followed by c
datasets, followed by a line containing the number `0'.
The first line of each dataset consists of a single positive integer, n
(0 < n < 100000)
, which is the number of buildings in the proposal. The following n
lines of each dataset each contains a description of a single building. The i
-th line is a description of building bi
. Each building bi
is described by three positive integers, separated by spaces, namely, li
, ri
and hi
, where li
and rj
(0 < li < ri 100000)
represents the left and right end point of the building and hi
(0 < h109)
represents the height of the building.
100000)
represents the left and right end point of the building and hi
(0 < h109)
represents the height of the building.
The output consists of one line for each dataset. The c
-th line contains one single integer, representing the amount of overlap in the proposal for dataset c
. You may assume that the amount of overlap for each dataset is at most 2000000.
Note:
In this test case, the overlap of building b1
, b2
and b3
are 6, 4 and 4 respectively. Figure 4 shows how to compute the overlap of building b3
. The grey area represents the skyline formed by b1
and b2
and the black rectangle represents b3
. As shown in the figure, the length of the skyline covered by b3
is from position 3 to position 5 and from position 11 to position 13, therefore the overlap of b3
is 4.
1
3
5 11 3
1 10 1
3 13 2
0
14