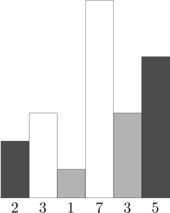
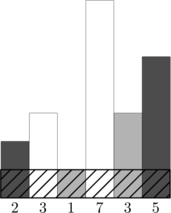
A histogram is a polygon composed of a sequence of rectangular bars aligned at a common base line. All bars have equal widths but may have different integer heights. Additionally, each bar is fully colored with a single color. For example, the figure below shows the histogram that consists of bars with the heights 2, 3, 1, 7, 1, 3, 5, measured in units where 1 is the width of each bar. In this case, every bar is colored with one out of three colors:
There are a lot of rectangles that can be placed inside this histogram (infinitely many, in fact). We will say that a rectangle is nice if and only if:
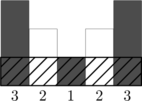
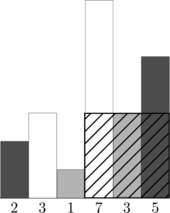
Here are some examples of rectangles that are not nice:
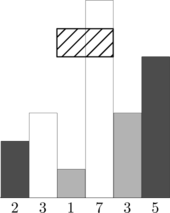
The rectangles in the two leftmost figures are not nice because they don’t lie completely inside the histogram. The rectangle in the rightmost figure is not nice because the total white area covered is not strictly positive, and a nice rectangle must cover a positive area of every color.
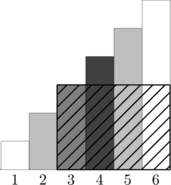
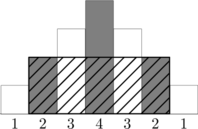
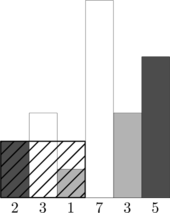
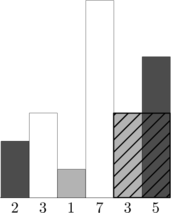
On the other hand, here are some examples of nice rectangles:
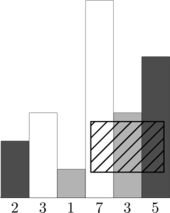
The area of the nice rectangle in the leftmost figure is 6 × 1 = 6 square units, the area of the nice rectangle in the middle figure is 3 × 3 = 9 square units and the area of the nice rectangle in the rightmost figure is 1.8 × 2.6 = 4.68 square units.
Clearly, the area of the rectangle in the middle figure is largest. In fact, it turns out it doesn’t exist a nice rectangle for this histogram with a larger area!
In this problem, you are given a histogram and your task is to compute the maximum area of all the possible nice rectangles. By the way, it is not hard to prove that this area will always be an integer.
Input
The input contains several test cases (at most 50).
Each test case is described by several lines. The first line contains two integer  and
and  , the number of bars and
the total number of colors in the histogram, respectively (1 ≤ ≤ 105 and 1 ≤ ≤ min(30, )).
, the number of bars and
the total number of colors in the histogram, respectively (1 ≤ ≤ 105 and 1 ≤ ≤ min(30, )).
The following line contains integers hi, the height of the ith bar from left to right (1 ≤ hi ≤ 109). The
following line contains integers ci, the color of the ith bar from left to right. Each color is represented as an
integer between 0 and - 1, inclusive. You can assume that for each histogram there will be at least one bar of
every color.
The last line of the input contains two zeros and should not be processed.
Output
For each test case, output a single integer on a single line — the area of the largest nice rectangle for this histogram.
Sample input and output
|
standard input
|
standard output
|
|
6
3
2 3 1 7 3 5 2 0 1 0 1 2 3 1 2 2 2 0 0 0 5 2 3 2 1 2 3 1 0 1 0 1 6 4 1 2 3 4 5 6 0 1 2 3 1 0 7 2 1 2 3 4 3 2 1 0 1 0 1 0 1 0 10 2 2 1 2 1 1 2 1 2 2 1 1 0 0 0 1 0 0 1 1 0 3 2 1000000000 999999997 999999999 0 1 1 0 0 |
9
6 5 12 10 10 2999999991 |
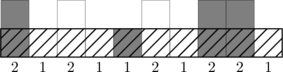
Explanation of the sample cases
Below are some of the sample test cases with their respective largest nice rectangles: