|
H
|
Line
Chart
Input: Standard Input
Output: Standard Output
|

|
ACRush is
very famous in Supercoder. Supercoder is a professional company which arranges online
algorithmic contests and rates peoples based on those contests. In Supercoder
algorithm contest ranklist, ACRush is ranked third. Now a days he is doing some
analysis on his rating history in Supercoder algorithm contest. In Supercoder,
an algorithm contest is termed as a Single
Round Tournament (SRT). After
each SRT is finished, rating of a contestant is updated according to his/her
relative performance. ACRush collected all these rating information, and using
those he created a line chart.
To make things more clear, let us consider the following
table as his rating info.
|
SRT
|
Rating
|
|
320
|
3
|
|
306
|
1
|
|
401
|
3
|
|
325
|
4
|
|
393
|
5
|
|
380
|
2
|
From this table, we see that his first SRT was SRT#306, and rating after that SRT
was 1, so he
marked point (1, 1) as r1 in graph paper, his
second SRT was SRT#320 and rating after that SRT was 3, so he marked (2, 3) as
r2, then he add r1 with r2 by a straight line
and so on.
In general for his ith SRT he marked point (i, rating after ith
SRT) by ri.
After marking all the points he will add point ri with ri-1
by straight lines, for all 1 < i <=N, Where N is the total number
of SRTs he played. For better idea look at figure 1:
|

Fig 1: Line chart cosidering all SRTs
|
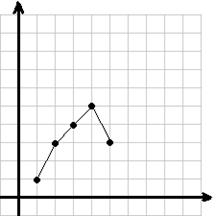
Fig 2: Line chart ignoring SRT #380
|
After drawing line chart, he
became very interested about the number of peaks. There are two kinds of peaks
in a line chart, 1) Upper Peak and 2) Lower Peak.
Upper Peak is that point in a line chart whose
previous and next point has smaller y coordinates and lower peak is that points
in a line chart whose previous and next point has greater y coordinates. For
example total number of peak in figure 1 is 3. Two of them upper peak, which
are (3, 4) and (5, 5), and one of them is lower peak which is (4, 2).
ACRush observed that by ignoring SRT#380, his line chart will become like
figure 2, in which number of peak is only 1. By observing this he became more
curious. Now he wants to know, by ignoring 0 or more SRTs how many distinct
line charts having K peaks is possible. ACRush calls these line charts “K-peak
Line charts”, in a K-peak line chart he doesn’t allow two consecutive points to
have same y coordinate.
Input
Input will start with an
integer T ( T ≤ 12 ), which indicates the number of test cases. Each case
starts with a line having two integers N (1 ≤N ≤ 10000) and K ( 0 ≤
K ≤ 50 ). Each of the next N lines will contain two integers SRT ( 1 ≤
SRT ≤ 1000000000) and Rating ( 1 ≤ Rating ≤ 1000000000 ). All
the SRT numbers will be distinct.
Output
For
Each test case output a single Line "Case #: W", here # will be
replaced by case number and W will be replaced by the number of distinct K-peak
line charts modulo 1000000.
Sample Input Output for
Sample Input
|
3
6
1
320
3
306
1
401
3
325
4
393
5
380
2
4
1
101
3
102
2
103
2
104
4
3
0
102
2
101
1
103 3
|
Case
1: 20
Case
2: 1
Case
3: 8
|
Problem setter: Md. Arifuzzaman Arif, Special Thanks: A. A.
mahmud, S. Hafiz, R. Liu